return to main page
The Pluto occultation of 18 March 2007
(visible from S.W. USA, Northern Mexico)
On 18 March 2007 a little bit before 11:00 UT, Pluto and its atmosphere
will occult a V~15 star for up to 6 mn for central events.
Because the star in very red (see below), observations in R, I, or J, H, K, are most suggested.
Even though larger telescopes will yield higher SNR, smaller amateur instruments (25-50 cm)
can yield extremely valuable contribution for pinning down the astrometry of the event
(combining various occultation chords), by helping to detect a possible central flash,
and by giving firmer confirmation on possible changes occurring right now in Pluto's
tenous atmosphere.
This page provides practical information (predictions, star magnitude, charts, etc...),
as well as some scientific rationale.
Updated predictions will be posted on this page when available. Stay tuned!
For contacts, more information and/or comments, you can contact me me email at:
bruno.sicardy@obspm.fr
Independent predictions by
Leslie Young
are also available for this event.
Circumstances of the event
Update: 13 March 2007
Occulted star position (referred to UCAC2 positions), has been measured by Raoul Behrend, March 2007,
based on 1.2m-swiss telescope ESO/La Silla.
Typical announced accuracy on star position: 0.015 arcsec (NB. Pluto's angular diameter is about 0.11 arcsec).
Note: A correction of +12 mas in r.a. and +5 mas in dec. has been applied to go from UCAC2 to ICRF positions.
The star position is then (Raoul Behrend, 1.2m swiss telescope, ICRF, March 2007):
r.a.= 17h 55mn 5.6971 sec
dec.= -16d 28' 34.360" (ICRF J2000)
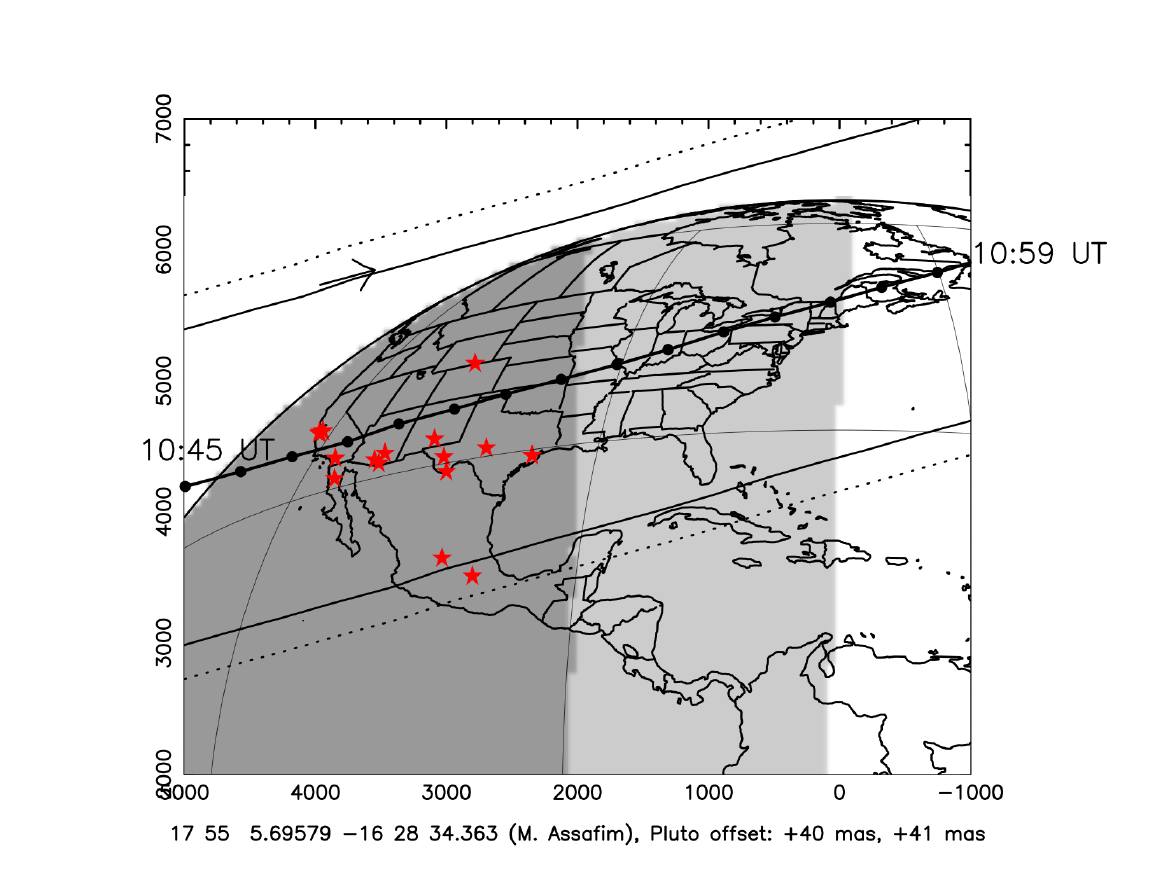
Using the 1.6m and 0.6m Pico do Dias telescopes in Brazil, the Rio de Janeiro astrometric group obtains the following position, March 2007:
(NB. A correction UCAC2 ---> ICFR has been applied as above)
r.a.= 17h 55mn 5.69579 sec
dec.= -16d 28' 34.363" (ICRF J2000)
We use the DE413 ephemeris for Pluto
(see Horizons on line),
and we apply an offset of +40 mas in r.a. and +41 mas in dec., as observed during the 12 June 2006
Pluto occultation.
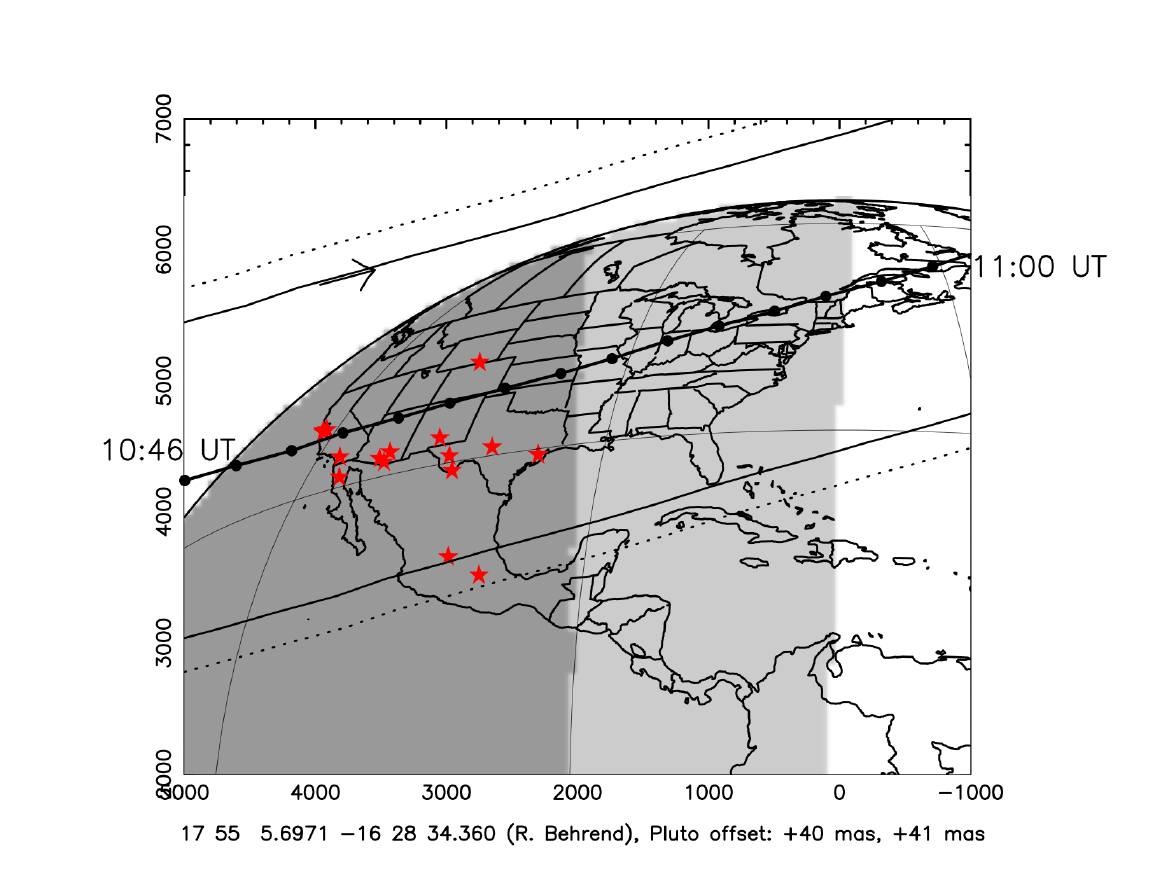
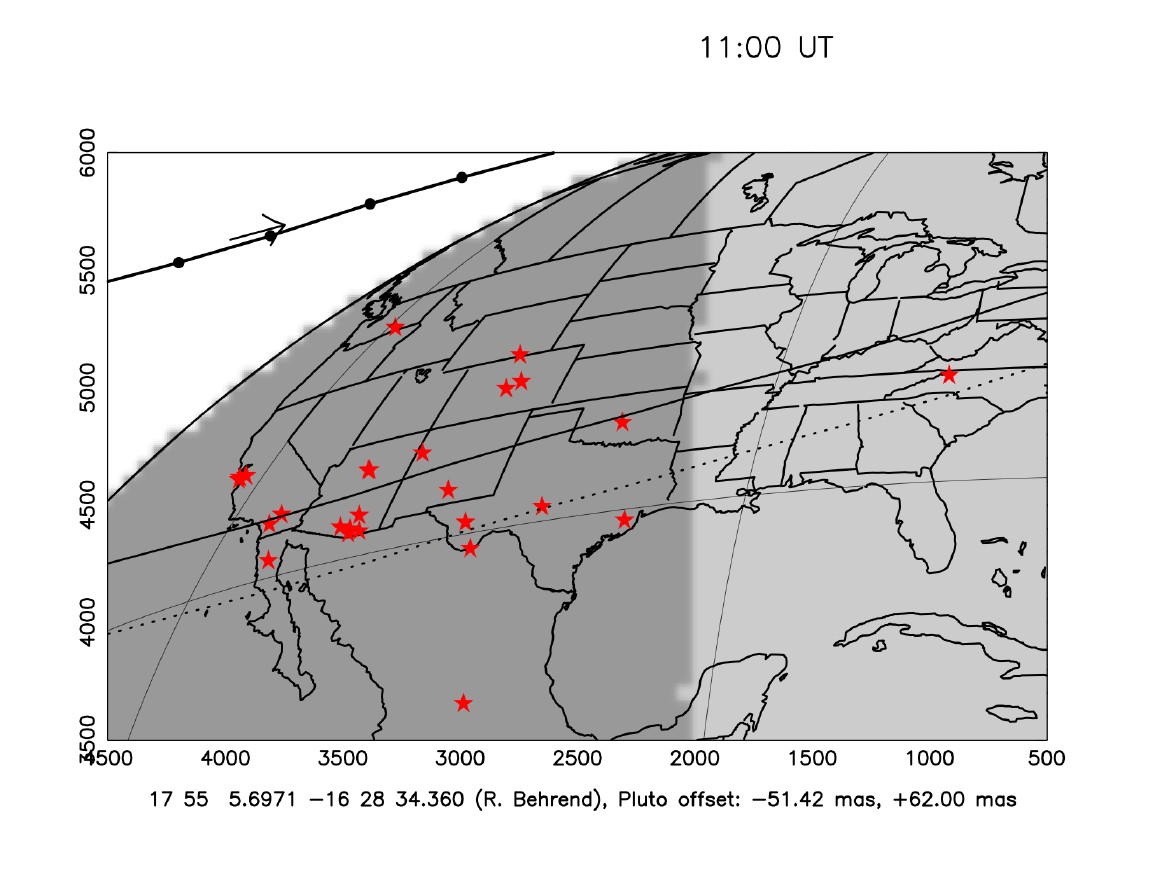
The resulting map showing Pluto's shadow on the Earth is shown below.
Dark zones on Earth are in night, light grey in twilight, and white in day time.
Pluto's shadow is moving from **left to right** at about 7.08 km/sec, see arrow.
The dots along the central occultation line are plotted every minute along Pluto's shadow center,
with some marking at specific UT times
The two solid lines correspond to Pluto's geometric shadow (width ~ 2400 km).
The two dotted lines correspond to the zone band inside which Pluto's atmospheric occultation will be
detectable, i.e. will cause a drop of signal larger than a few percents.
Maximum duration of event is a little bit more than 6 mn.
The red star symbols give some potential observing sites where various teams could be deployed.
!!! **
Uncertainties on predictions should be in the range +/- 1000 km in NS direction, and +/- 5 mn in time, dominated by the
uncertainties on Pluto's ephemeris (not by star position uncertainties).
Furthermore, wo do not know how the Pluto offset of (+40 mas, +41 mas) quoted above has propagated from June 2006 to March 2007.
Consequently, this calculation only serves to show how a typical Pluto offset can affect the occultation geometry.
** !!!
Note that if we do not apply the +40 mas in r.a. +41 mas in dec. to Pluto's ephemeris, then the maps are:
The map below gives the iso-elevation curves of Pluto above the local horizon, at the moment of event:
What is to be expected? Why is it interesting?
The graphs in the table below show the expected stellar flux (normalized between 0= no star and 1= full star)
as a function of time, in seconds, assuming a shadow velocity of a little bit more than 7 km/sec in the plane
of the sky.
These curves result from ray tracing, using Pluto's atmospheric models derived from occultations observed in
2002 and 2006.
The difference between the curves is the impact parameter p,
i.e. the closest approach of the observer to Pluto's shadow center.
A first goal of these observations is to see whether changes from this model are detectable,
showing possible changes in Pluto's atmosphere over the years.
The longest possible event, a little more than 6 mn for the 18 March 2007 event,
corresponds to central events (p= 0 km).
In this case, one should observe a spectacular central flash, lasting for some 30 sec at most. In the case shown here
(upper left diagram), we assume that Pluto's atmosphere is spherically symmetric.
Assymetries (caused, e.g. by winds) would distort the atmosphere, and change drastically the shape of the flash.
This is a second goals of the observation: see how distorted is Pluto's atmosphere.
Note that the central flash rapidly disappears as p increases.
For instance, at p= 100 km, the central flash is only 10% of the full unocculted flux.
However, multiplying the observing sites will increase the chances that someone detects
the central flash.
The lower left panel shows a light curve in an intermediate case: p= 600 km, corresponding to
half-way between the shadow center and the edge of the geometric shadow (<~ 1200 km).
The last panel shows than even outside the geometrical shadow, e.g. p= 1300 km, an
occultation can be detected. Practically, observers at p= 1400 km (i.e. more than 200 km outside
the geometric shadow), could still detect the event, caused by refraction of the upper atmospheric layers.
Click on images for enhancement
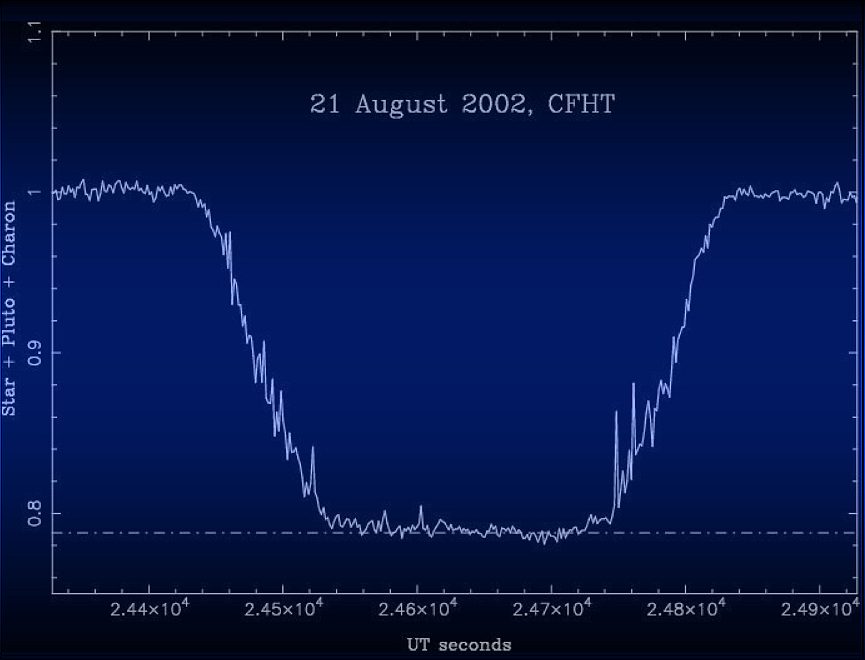
Note that is reality, the observed light curve will not be smooth as shown above.
Small temperature variations in the atmosphere can cause "spikes", see below the light curve obtained from
CFHT at Hawaii during a Pluto occultation in 2002.
This is a third goal of this observations:
it will be interesting to map those spikes by comparing them from site to site. Correlations between nearby
light curves could help understanding the structure of these features (horizontally stretched gravity waves,
local isotropic turbulences, etc...)
Observing tips
Acquisition time cycle:
1-2 sec would be nice. At 7 km/sec, this corresponds to a fraction of
scale height in Pluto's atmosphere (20-50 km depending on region).
Even 10 sec intervals can be useful for astrometric purposes, to know where the
star went wrt Pluto.
Filters:
The star is red (see below), so that observing in R or I will increase the contrast of the occultation.
For instance, in V, the star is 0.5 magn. **fainter** than Pluto, while it is as bright as the planet
in I, and more than 2 magn. **brighter** than Pluto in K!
TESTS SHOULD BE PERFORMED BEFOREHAND to optimize SNR according to your
instrument and receptor.
Remember that filters can help increase the contrast, but they reduce the photon flux.
Calibrations:
In the synthetic light curves shown above, the flux corresponds to the star contribution **only**.
In reality, at the moment of the occultation, one will record **both** Pluto's and stellar fluxes.
For instance, in I band, ~50% of the total flux will come from the planet, and ~50% from the
star.
IT IS EXTREMELY IMPORTANT, for further analysis, to be able to take away Pluto's flux from the
light curve.
This means carefully calibrating Pluto's flux vs. the stellar flux before or after the event,
when they are well separated.
Another, complementary, method is to acquire simultaneously with the occultation **another** nearby
star. This help correcting flux variations on the occulted star caused by clouds, hazes, etc... Another
advantage is that it allows an independent calibration, by observing again the two stars under the same
conditions some days before or after the event, and eventually remove Pluto's flux from the occultation
light curve.
Of course, this calibrating star should chosen as bright as possible (FOV allowing), to obtain the best
SNR. Otherwise, it will only add noise to noise...
Below are some more technical information (charts, magnitudes, etc...)
Charts from 1.2m-swiss telescope ESO/La Silla (left: V, right: R)
North is up, East is left. Fields of view are 1.5x1.5 arcmin
see Vizier service for star magnitudes:
| Star magnitudes: |
B= 16.4 |
V= 14.9 |
R= 14.1 |
I= 13.6 |
J=12.0 |
H= 11.2 |
K= 10.9 |
| Pluto/Charon: |
B= 15.3 |
V= 14.4 |
|
I= 13.6 |
J= 13.0 |
H=12.8 |
K= 13.1 |
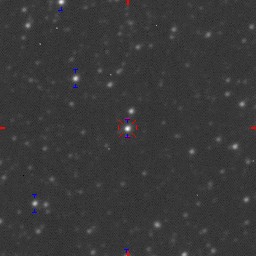
Charts from Guide software
North is up, East is left.
Dimension of fields of view refer to the vertical (NS) direction
Preliminary results
Based on report from Calvin-Rehoboth Obs. (NM)
Palmer Divide (CO) and
Cloudbait Obs. (CO) ,
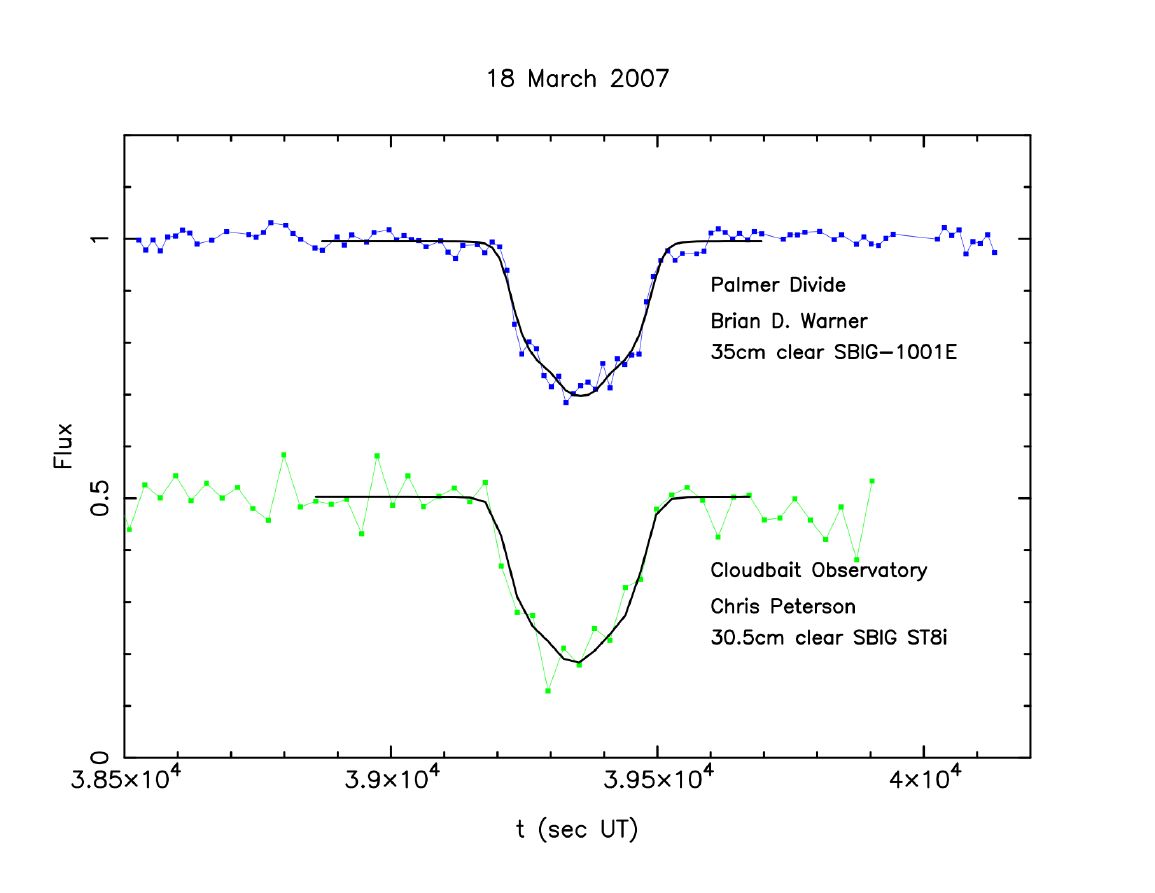
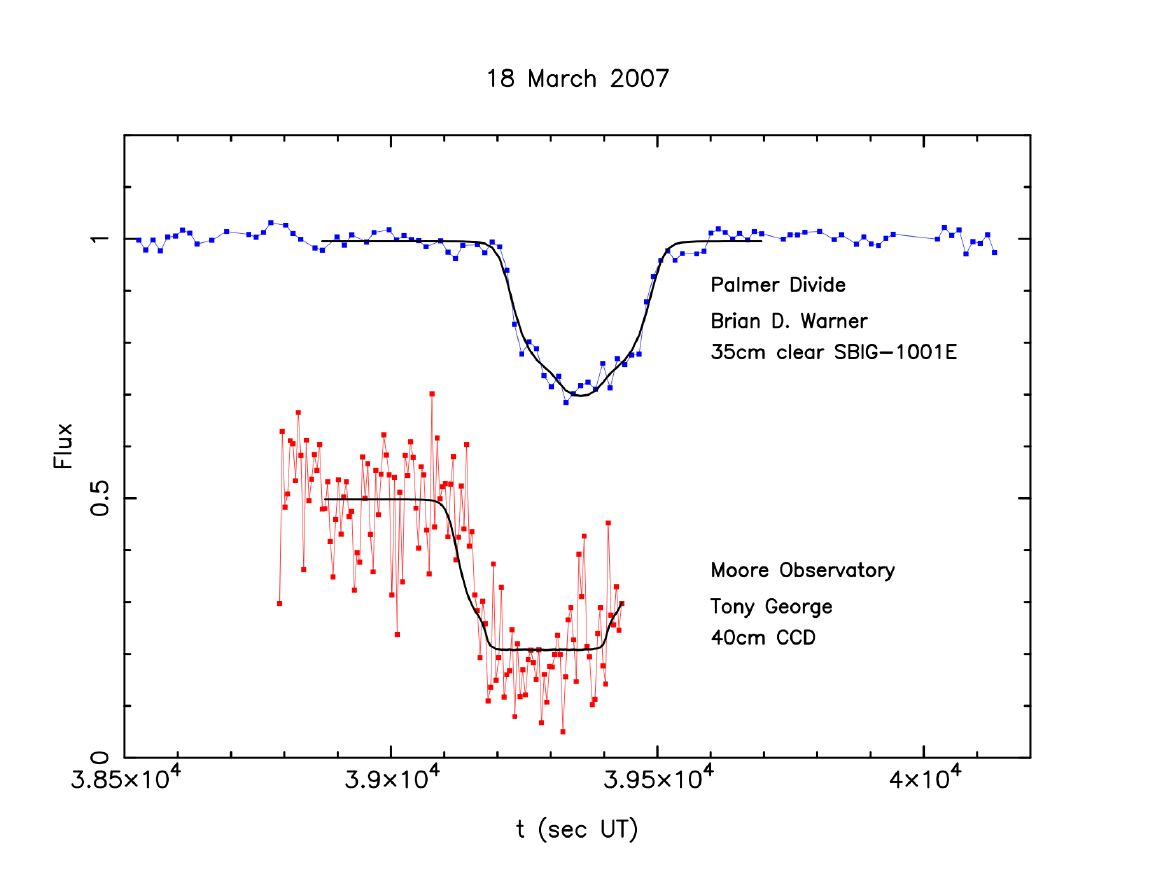
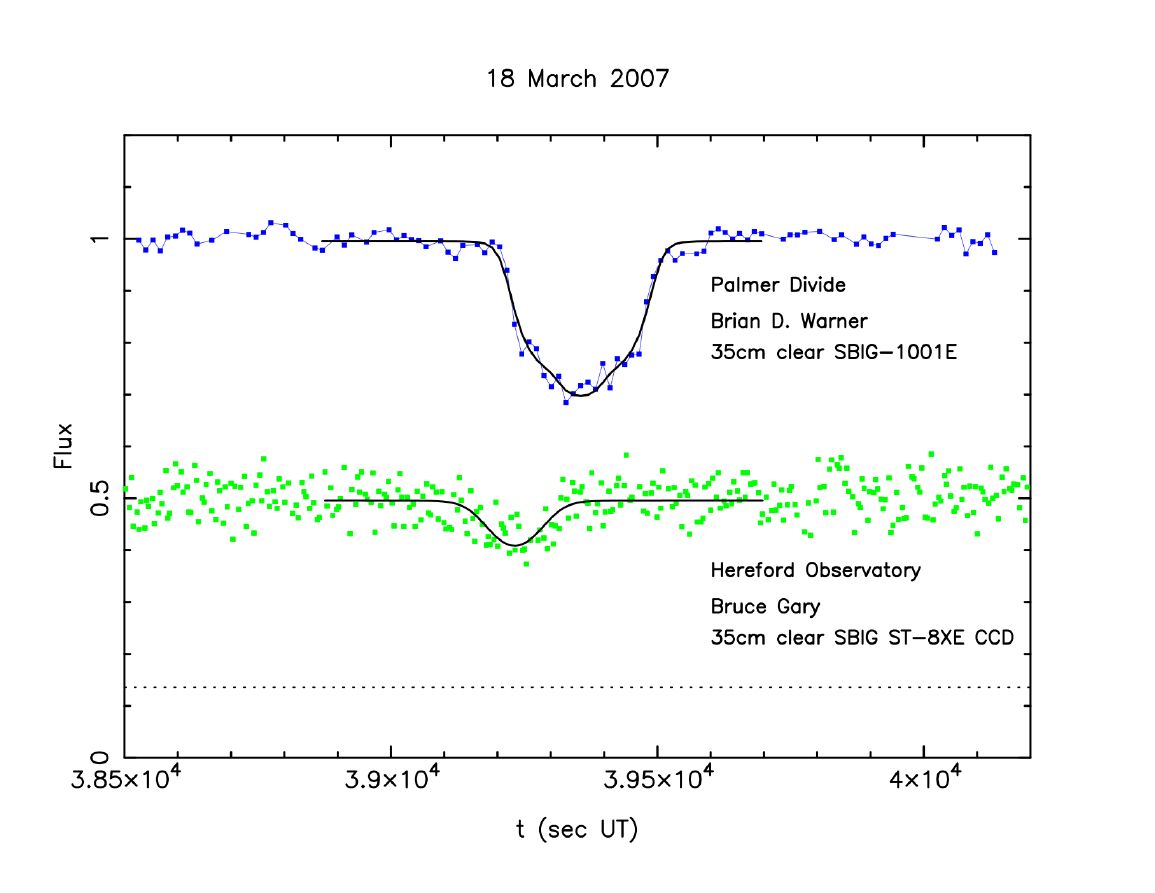
we obtain the following fits the the light curves at those stations:
The Palmer Divide (blue curve) flux is actually the sum of the star and Pluto's fluxes, normalized to unity outside the occultation.
Same convention for the Calvin-Rehoboth light curve (in red), except that it has been vertically shifted by -0.5 for better visibility.
Same for Cloudbait, Moore and Hereford.
These fits assume that Pluto's atmosphere did not vary significantly since 2002, which should give a rough geometry of the event,
as illustrated below:
The solid lines defining the shadow band are where the **stellar** flux reaches half of its full unocculted value.
The dotted lines define the zone where the drop in stellar flux is barely detectable, i.e. 1-2 %.
The map below shows the various trajectories of the iso-stellar drops (1, 2, 5, 10, 50, 70 and 90%):
From this preliminary astrometry, we obtain the following expected stellar drops as various stations.
Note that the unocculted **stellar** flux has been normalized to unity, while the zero **stellar** flux has been fixed to zero.
Thus, the contrasts of the occultation in real light curves is not so pronounced as here, since one has to add Pluto's flux
to the light curves.
Expected light curves based on preliminary post-observation astrometry
return to main page
About the background image: preparing the observation of the 12 June 2006 Pluto occultation from Mt John Observatory,
New Zealand. Photograph by Bruno Sicardy.


 20deg
20deg  5deg
5deg  1.5deg
  30'
30'  10'
10' 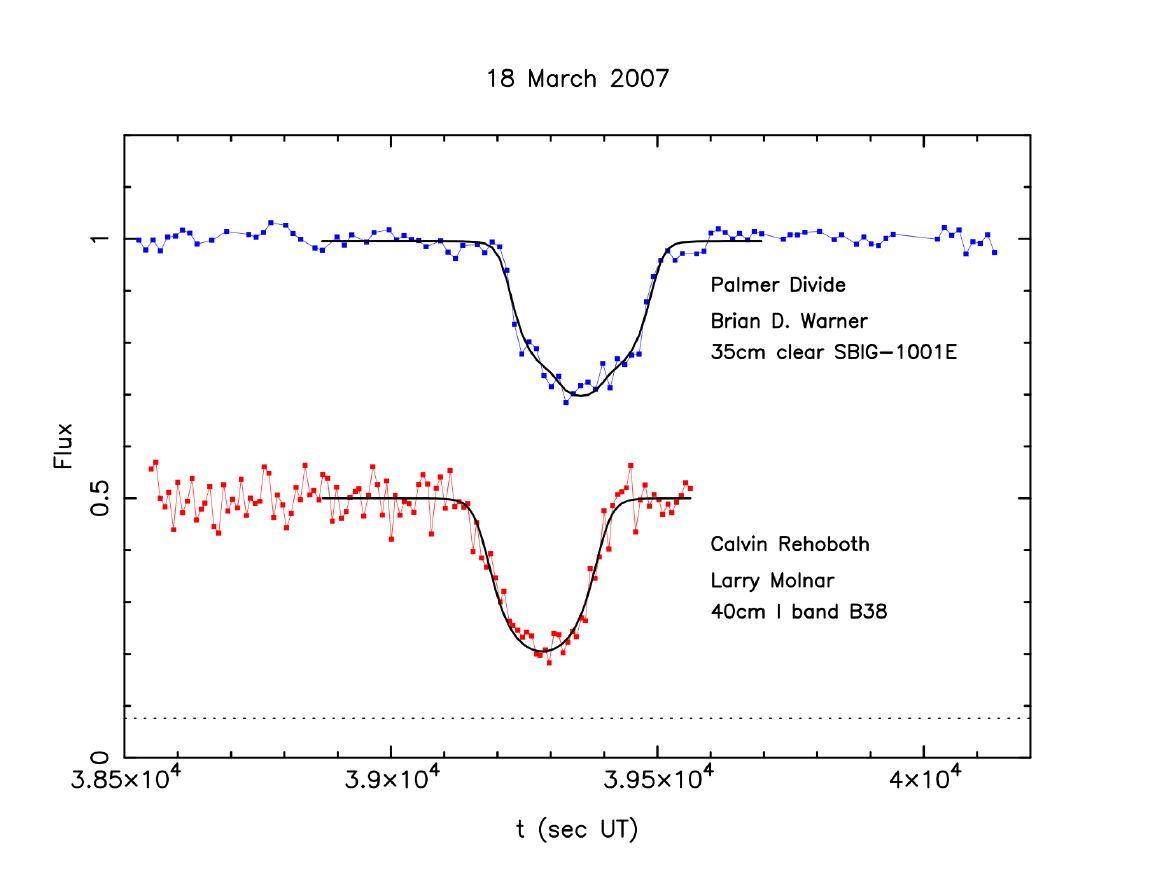


 Guanajuato
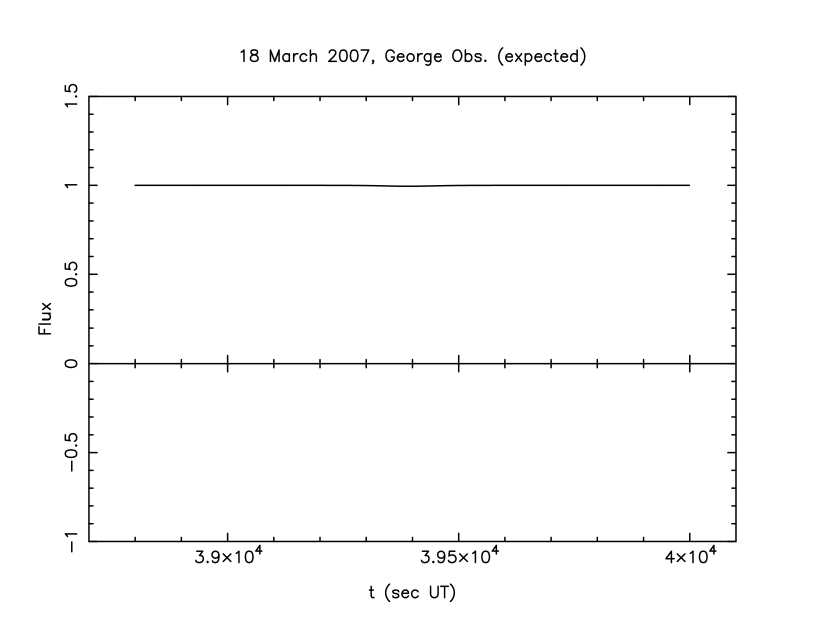 George
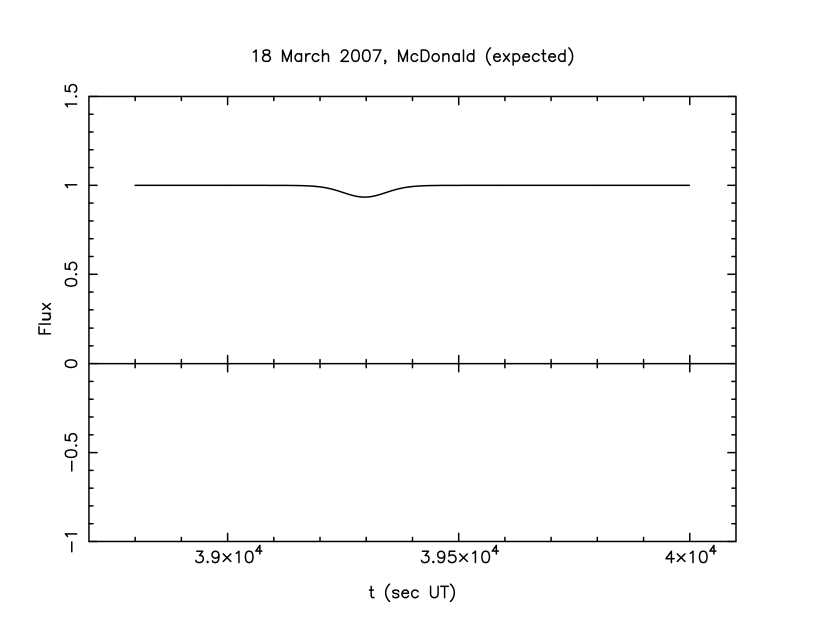 McDonald
 Dark Sky Appalachian
 San Pedro Martir
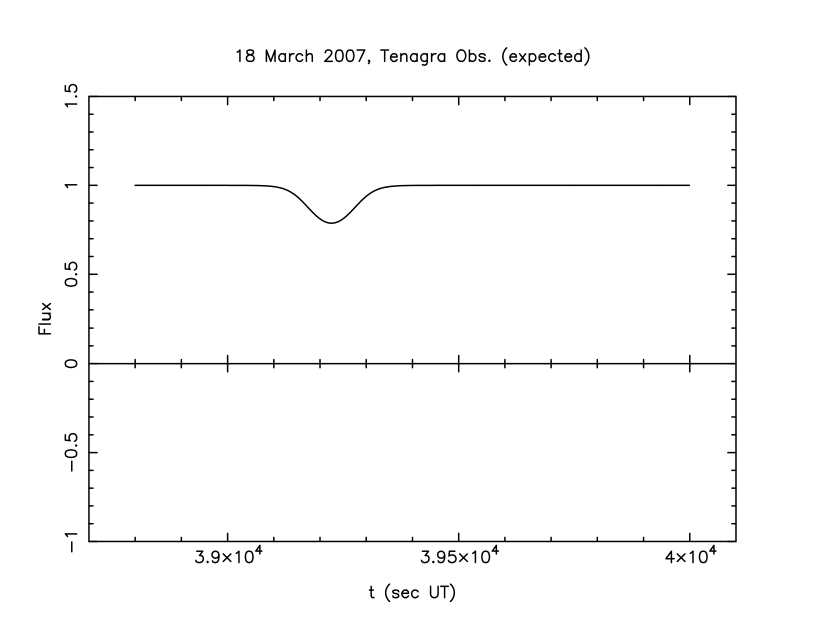 Tenagra
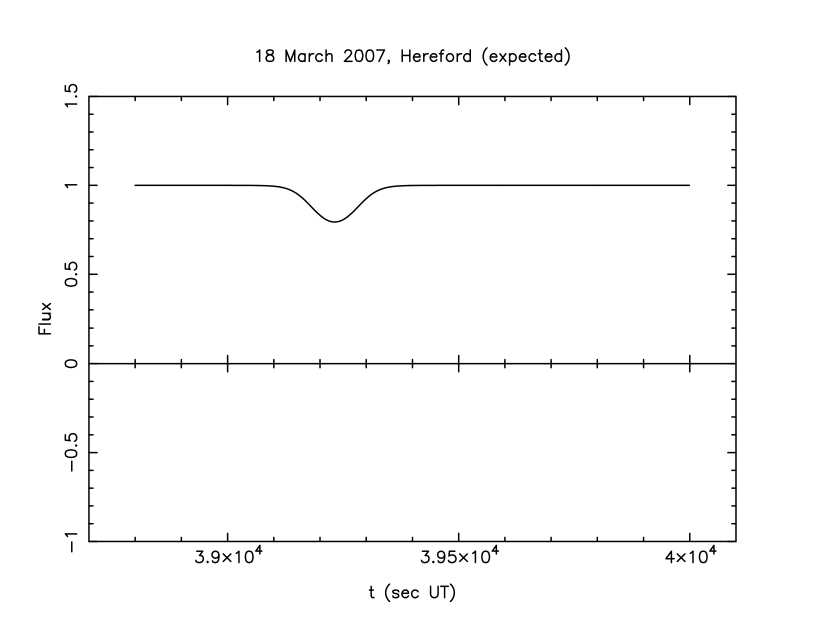 Hereford
 Mt Hopkins
 Kitt Peak
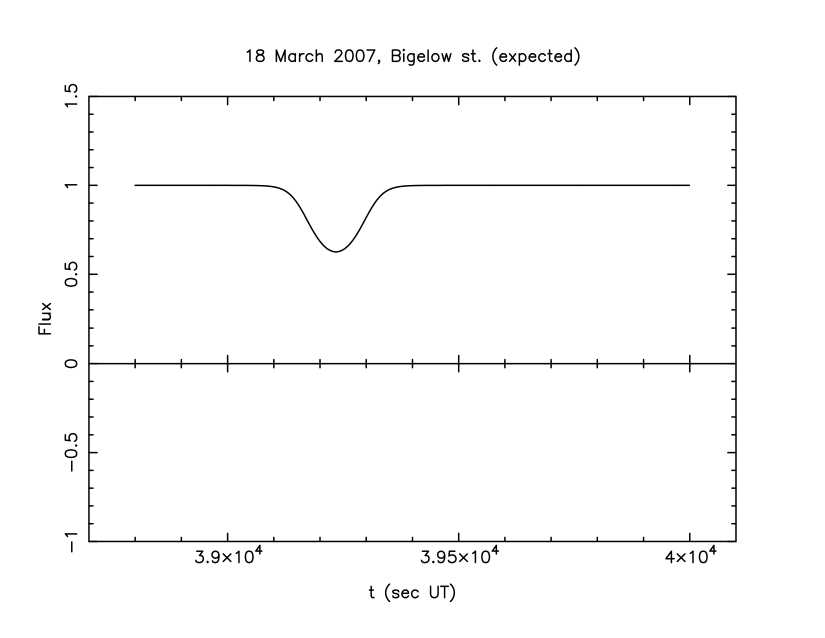 Bigelow St.
 Palomar St.
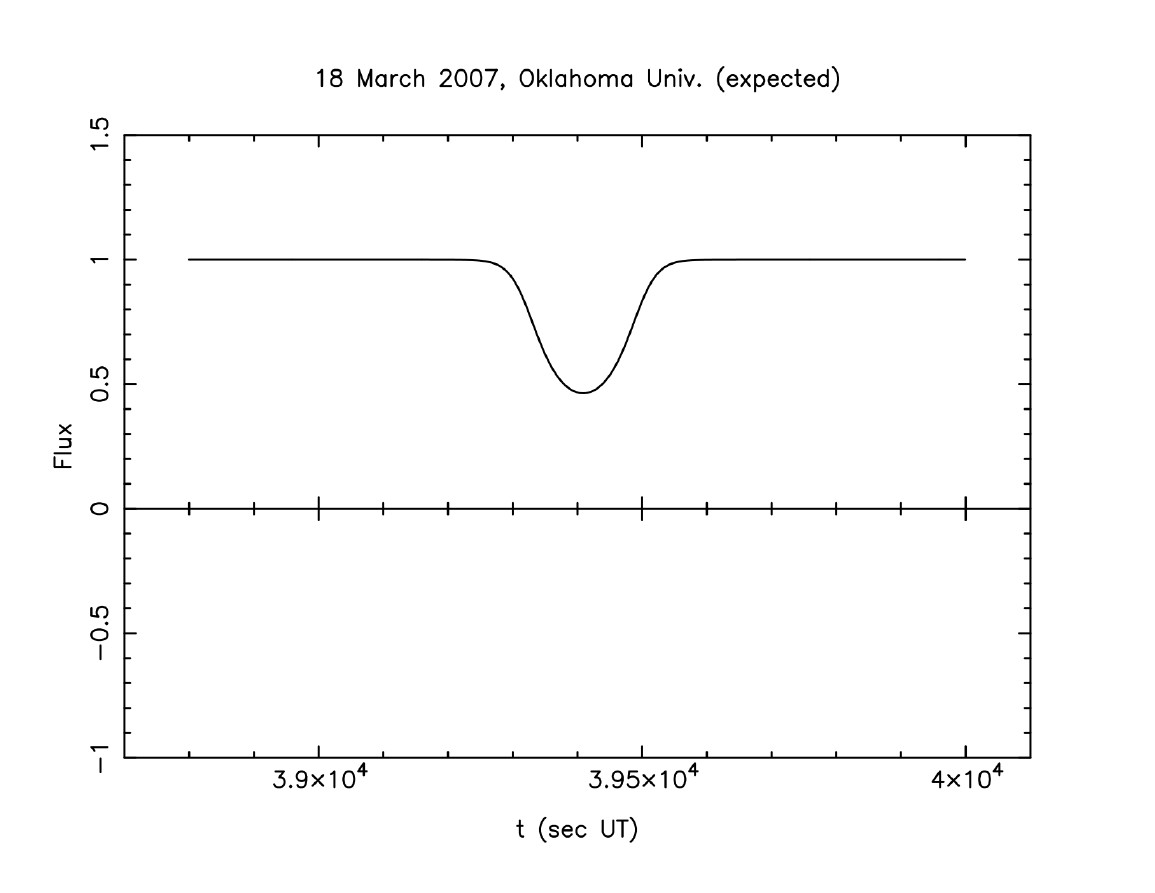 Oklahoma Univ.
 Pinto Valley St.
 Lowell Obs.
 Calvin-Rehoboth Obs.
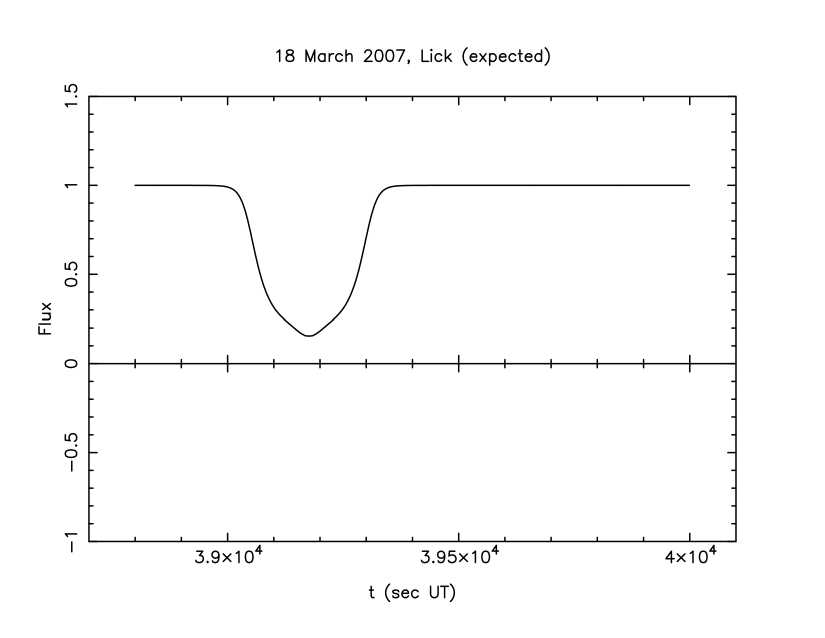 Lick
Lick Palmer Divide Obs.
 Cloudbait Obs.
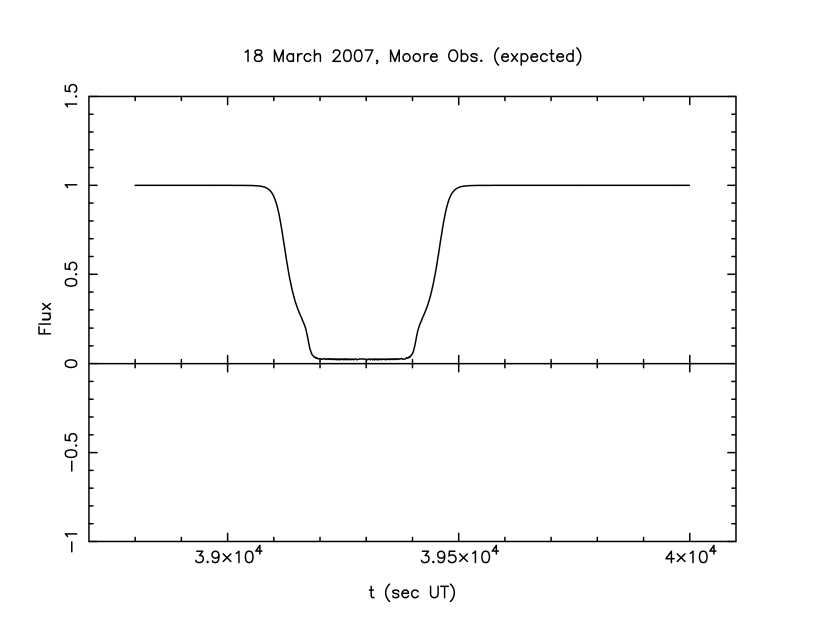 Moore Obs.