


Next: 3.2 Basics of the
Up: 3. A New Model
Previous: 3. A New Model
It is clear that the strong latitudinal gradient in electron
temperature, measured for the first time by Ulysses, requires a new
model of the latitudinal structure of the torus. Figure 2
demonstrates the limitations of using the Voyager-based model
[ Bagenal, 1994] to model the densities measured by Ulysses in the region
of the torus [ Hoang et al., 1993, Moncuquet et al., 1997].
Figure 2:
Electron density measurements from Ulysses (diamonds) compared to
profiles extrapolated from Voyager 1 measurements. The two thin curves are the
electron density profiles derived from the model of Bagenal
[1994] using the  magnetic field without current sheet and an isotropic
velocity distribution (upper) or with current sheet and anisotropy of
5 for the hot
electrons (lower). The dashed curve is a mid-range model ( + currentsheet
+ isotropy) [ NB: the difference between
magnetic field without current sheet and an isotropic
velocity distribution (upper) or with current sheet and anisotropy of
5 for the hot
electrons (lower). The dashed curve is a mid-range model ( + currentsheet
+ isotropy) [ NB: the difference between  and magnetic field
models is small at these distances]. The thick curve, which is limited to the
validity range of the polytropic law (i.e.
and magnetic field
models is small at these distances]. The thick curve, which is limited to the
validity range of the polytropic law (i.e.
 ) is the density
profile deduced from the simplified ``kappa-like'' model of
Meyer-Vernet et al., [1995].
) is the density
profile deduced from the simplified ``kappa-like'' model of
Meyer-Vernet et al., [1995].
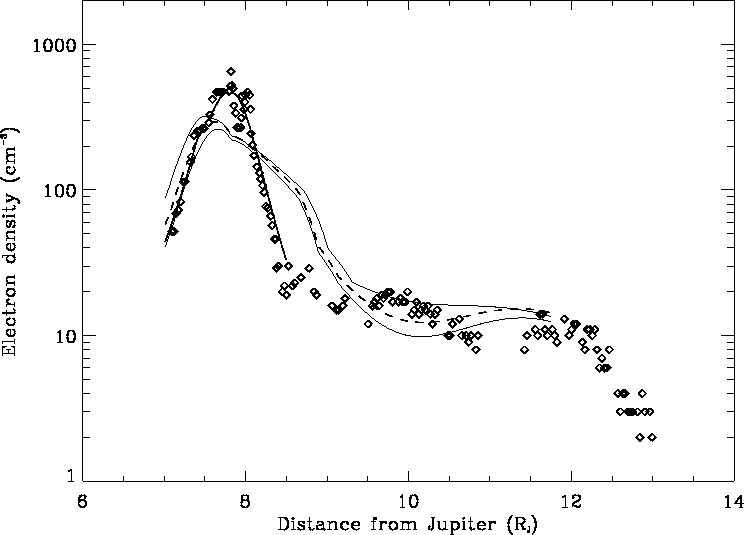 |
One can see that even with
fairly extreme ion anisotropies and with a wide range in magnetic field
models, the Voyager-based model cannot produce the tight confinement
of plasma to the equator as observed by Ulysses, whereas
Meyer-Vernet, Moncuquet and Hoang [1995] were able to
match the Ulysses
electron data with a single kappa velocity distribution for a single
ion species and electrons, but this model was admittedly oversimplified.
With data obtained along spacecraft traversals through the torus that
are widely separated in time, we are still limited to 2-dimensional
models (where plasma properties vary with centrifugal latitude and
radial distance but are assumed to be constant in the azimuthal
direction). Moreover, it is quite possible that the properties of the
torus have changed between the Voyager 1 flyby in 1979 and the
Ulysses traversal in 1992.
Remote sensing observations show that the torus density and
temperature vary on time scales of days to years [ Thomas, 1993].
Nevertheless, the purpose of this paper is to explore whether a single 2-D
model of plasma distribution (uniform in longitude), where the number of
adjustable parameter is kept to a minimum, is able to match the density
profiles observed at very different times and to reproduce the observed
variations in temperature with latitude.
Next: 3.2 Basics of the
Up: 3. A New Model
Previous: 3. A New Model
Michel Moncuquet
DESPA, Observatoire de Paris
2001-08-28