 |
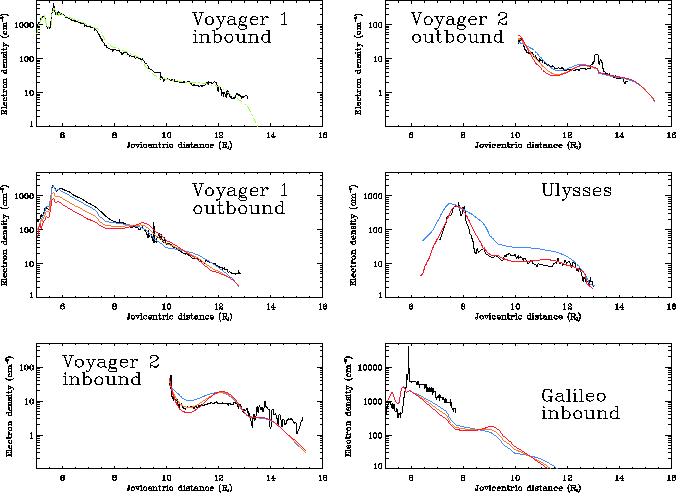
To match the Ulysses measurements we had to enhance the total charge
density throughout the torus by a factor of 1.9 compared with the
Voyager epoch. This enhancement is comparable to the higher overall
densities measured by Galileo in 1995 [ Frank et al., 1996, Gurnett et al., 1996, Bagenal et al., 1997].
The Ulysses measurement of the tight confinement of
the density to the equator (illustrated by the narrow peak around
8![]() ) could not be matched by using an isotropic kappa, nor by a
highly anisotropic (
) could not be matched by using an isotropic kappa, nor by a
highly anisotropic (![]() ) bi-Maxwellian. On the other hand, after
selecting a normalization factor (1.9) and values of
) bi-Maxwellian. On the other hand, after
selecting a normalization factor (1.9) and values of ![]() and
and
![]() to match the equatorial confinement, the densities were also
very well matched beyond 9
to match the equatorial confinement, the densities were also
very well matched beyond 9![]() when Ulysses was at high
latitudes. The model/data rms is
when Ulysses was at high
latitudes. The model/data rms is ![]() for case (iii), 270%
for case (i).
for case (iii), 270%
for case (i).
When comparing the model (based on Voyager 1 inbound conditions) with
the densities measured on the
Voyager 1 outbound passage, we see that
the densities beyond 9![]() match very well, but in the main part of
the torus the observed densities are about a factor of 3 higher than
predicted by the anisotropic (
match very well, but in the main part of
the torus the observed densities are about a factor of 3 higher than
predicted by the anisotropic (![]() ) bi-kappa model.
Since the latitudinal ranges of the inbound
and outbound passes are similar, this substantial difference in
density level suggests a strong longitudinal asymmetry in the torus.
This asymmetry had already been noted from comparison with previous models
by Hoang et al. [1993].
When we compare the longitude of the spacecraft with the longitudinal
variations in emission intensity observed by
Schneider and Trauger [1995], however,
we find that the ground based emissions predict the opposite of what
was observed (namely, that the outbound densities should have been
lower rather than higher than those based on the inbound
observations). Of course, this might also suggest that the
temperature anisotropy is not constant throughout the
torus but instead weaker between 6 to 9
) bi-kappa model.
Since the latitudinal ranges of the inbound
and outbound passes are similar, this substantial difference in
density level suggests a strong longitudinal asymmetry in the torus.
This asymmetry had already been noted from comparison with previous models
by Hoang et al. [1993].
When we compare the longitude of the spacecraft with the longitudinal
variations in emission intensity observed by
Schneider and Trauger [1995], however,
we find that the ground based emissions predict the opposite of what
was observed (namely, that the outbound densities should have been
lower rather than higher than those based on the inbound
observations). Of course, this might also suggest that the
temperature anisotropy is not constant throughout the
torus but instead weaker between 6 to 9![]() than beyond.
It is also worth noting that the isotropic Maxwellian provides a
significantly better fit in this region
than either of the kappa distributions, with a model/data rms of
than beyond.
It is also worth noting that the isotropic Maxwellian provides a
significantly better fit in this region
than either of the kappa distributions, with a model/data rms of ![]() ,
against 26% for case (ii) and 36% for case (iii).
,
against 26% for case (ii) and 36% for case (iii).
When comparing the model with the Voyager 2 data
(from [ Belcher, 1983, figure 3.14]), obtained 6 months after
Voyager 1, we find that the bi-kappa model, without any normalization factor,
matches the densities at closest approach to Jupiter which occurred close to
the equator at about 10![]() .
The model/data rms are: on inbound for cases (i) 68%, (ii) 48%, (iii) 56%
and on outbound for cases (i) 29%, (ii) 25%, (iii) 34%.
More precisely, a quasi isotropic (
.
The model/data rms are: on inbound for cases (i) 68%, (ii) 48%, (iii) 56%
and on outbound for cases (i) 29%, (ii) 25%, (iii) 34%.
More precisely, a quasi isotropic (![]() )
kappa model (
)
kappa model (![]() ) yields the correct density gradient when the
spacecraft comes (inbound as well as outbound) from the centrifugal equator up
to higher latitudes (with a maximum at
) yields the correct density gradient when the
spacecraft comes (inbound as well as outbound) from the centrifugal equator up
to higher latitudes (with a maximum at
![]() south) at a Jovicentric
distance of
south) at a Jovicentric
distance of
![]() (see Figure 1).
On the inbound trajectory, however, when the spacecraft is close to the
equator again, say around
(see Figure 1).
On the inbound trajectory, however, when the spacecraft is close to the
equator again, say around ![]() , the model over-predicts the
observations by about a factor of 2. In contrast, the model under-predicts the
observations by about the same factor beyond
, the model over-predicts the
observations by about a factor of 2. In contrast, the model under-predicts the
observations by about the same factor beyond ![]() , when the
spacecraft returned to high latitudes. This difference might be explained by the
plasma being hotter (and thus spread farther
from the equator) at the time of Voyager 2. A hotter plasma at the
time of Voyager 2 is consistent
with higher electron temperatures inferred from UV emissions by
Sandel et al. [1979].
On the other hand, the differences might also be due to distortions
in the magnetic
field by a change in the equatorial current sheet, which can be significant
beyond
, when the
spacecraft returned to high latitudes. This difference might be explained by the
plasma being hotter (and thus spread farther
from the equator) at the time of Voyager 2. A hotter plasma at the
time of Voyager 2 is consistent
with higher electron temperatures inferred from UV emissions by
Sandel et al. [1979].
On the other hand, the differences might also be due to distortions
in the magnetic
field by a change in the equatorial current sheet, which can be significant
beyond ![]() .
.
We have also shown on Figure 5 the electron density
profile (from [ Bagenal et al., 1997]) measured by Galileo during its pass through the
torus on December 7th, 1995. In the outer part of the IPT, the electron
density observed by Galileo is roughly a factor of two higher than
the Voyager 1
value, and so about the same as the equatorial density inferred from Ulysses
observations. Unfortunately, data are available only inward ![]() and,
because the Galileo inbound trajectory was very close to the centrifugal
equator at these distances (see Figure 1), these data cannot be
used to constrain our model. Let us remark, however, that the slope of the
decreasing density with distance is better predicted with a near-isotropic
kappa model (i.e.
and,
because the Galileo inbound trajectory was very close to the centrifugal
equator at these distances (see Figure 1), these data cannot be
used to constrain our model. Let us remark, however, that the slope of the
decreasing density with distance is better predicted with a near-isotropic
kappa model (i.e. ![]() and
and ![]() ) than with a Maxwellian core+halo
or with a higher anisotropy. It is also worth noting that all models fail to
predict the magnitude of the ledge observed by Galileo near
) than with a Maxwellian core+halo
or with a higher anisotropy. It is also worth noting that all models fail to
predict the magnitude of the ledge observed by Galileo near ![]() ,
even ignoring the spike associated with the close approach to Io.
,
even ignoring the spike associated with the close approach to Io.