

Next: 4.2.3 Variation in temperature
Up: 4.2 Matching the Model
Previous: 4.2.1 Electron density from
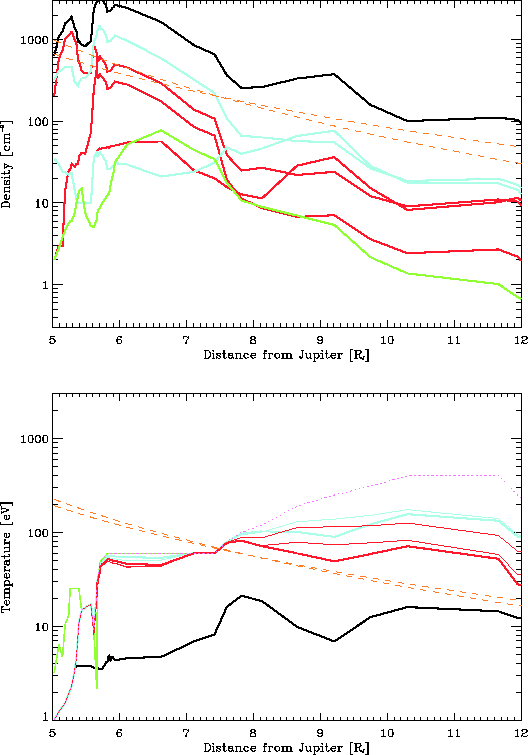
Figure 6 shows
the plasma parameters at the centrifugal equator extrapolated from data
measured along the spacecraft trajectory using equations
(10) and (12), with
 and
and
 for the ions, and
  (measured by
Ulysses) and
  (after [ Sittler and Strobel, 1987]) for the electrons.
These radial profiles along the centrifugal equator derived
using our bi-kappa model are
significantly different from those obtained by
Bagenal [1994] [see her
Figures 5& 6 ] at radial distances
greater than 8
 where the Voyager 1 spacecraft was well below the
centrifugal equator. Indeed because the bi-kappa distribution produces a
stronger confinement of the plasma to the centrifugal equator than
Maxwellian distributions, the equatorial densities are substantially
enhanced beyond 8
 .
.
Figure 6:
Densities and temperatures extrapolated from Voyager 1 to
the centrifugal equator, using a bi-kappa function
velocity distributions for the particles. (
 for
all the ions,
 for the electrons). We show
here the total densities (top) and the perpendicular temperatures
(bottom); electrons are in black, sulfur in red, oxygen in blue and
protons are in green. We have superposed the
former core+halo ion temperature(pink dotted line) and adiabatic
gradients (orange dashed lines) decreasing as
  or as
or as  for the
densities and as
  or as
or as  for the temperatures.
 |
The flatter radial profile of density has important implications for
the radial diffusion of plasma in the torus [ Siscoe and Summers, 1981]. Of even
greater significance, perhaps, is the difference in radial
temperature profiles produced by the two models illustrated by the
bottom panels of Figures 4 and 6.


Next: 4.2.3 Variation in temperature
Up: 4.2 Matching the Model
Previous: 4.2.1 Electron density from
Michel Moncuquet
DESPA, Observatoire de Paris
2001-08-28

