


Next: 3.3 What could be
Up: 3.2 Discussion
Previous: 3.2.1 What about an
We discuss here the fact that the occulted star is never a point source.
Indeed, the apparent radius of a star projected at 40 AU ranges from a fraction
of kilometer to several tens of kilometers (see section 5), i.e. of the same
order of magnitude as the KBOs. Therefore, the lightcurve smoothing over the
apparent stellar disk must be taken into account in our computation. In order to do so,
the star is considered as a set of incoherent point sources, with
polar coordinates  in a frame centered on the stellar disk.
If
in a frame centered on the stellar disk.
If  is now
the distance, in the occulting object plane, from the star disk center to the
object center, the normalized light intensity produced during an occultation
of a stellar disk of apparent radius
is now
the distance, in the occulting object plane, from the star disk center to the
object center, the normalized light intensity produced during an occultation
of a stellar disk of apparent radius  (again expressed in Fsu)
becomes:
(again expressed in Fsu)
becomes:
 |
(12) |
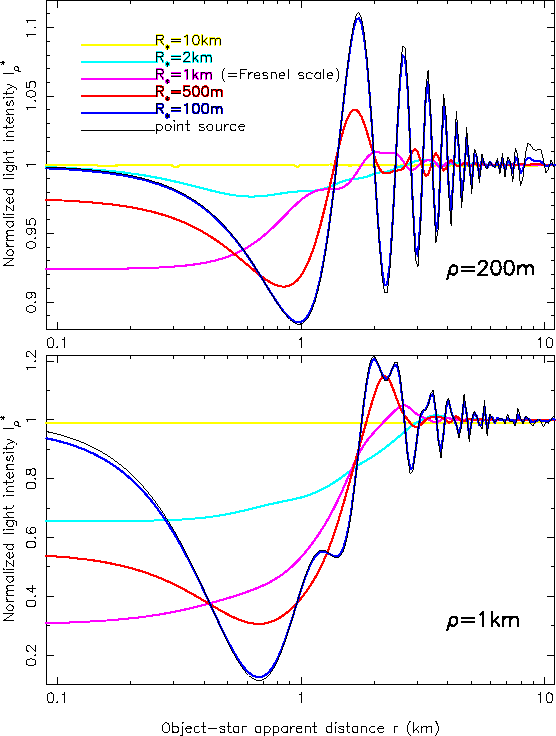
In Fig.2 we present occultation
lightcurves computed with Eq.12 and produced by a 200m (top) or a 1
km (bottom) KBO radius (within the two cases a Fresnel scale of 1km),
for several
different apparent stellar radii. As expected, the diffraction fringes are
strongly smoothed when the apparent stellar size is larger than the KBO itself. An
apparent stellar size of 2km reduces the largest diffraction effect of a
200m (1km) occulting KBO to only about 2% (30%) of the star light
instead of more than 10% (90%) with a small apparent stellar disk or a point
source. The diffraction with a 10 km apparent star disk is no longer
perceptible on this figure (though there is a 1% decrease in the light
intensity for the 1km object, which is simply the ratio of the areas, i.e.
as the object transits the star disk).
Figure 2:
Occultation profiles of a 200m radius KBO (top) and a 1km radius
KBO (bottom), smoothed on different sized stars, for a 1km Fresnel scale.
The apparent stellar radii are 0. (thin black curve), 100m (dark blue), 500m
(red), 1km (magenta), 2km (cyan), 10km (yellow).
 |
Next: 3.3 What could be
Up: 3.2 Discussion
Previous: 3.2.1 What about an
DESPA, Observatoire de Paris
2000-04-05