

Next: 5. Summary and Final
Up: 4. Building a 2-D
Previous: 4.2.3 Variation in temperature
To illustrate our new 2-D model of the IPT and the effect
of choosing values of  and
and  , we present
contours of plasma density in Figure 7.
Figure 7:
Contours of particle density in the meridian plane for System III longitude
of 292 . The x-axis gives distance from Jupiter (
 ), the y-axis
gives centrifugal altitude (
 ).
).
 .
All contour levels are spaced by factor of 2. The
electron contours decrease from 3200cm
 . The contours for
O
 , S
, S and S
and S decrease from 1600cm
 and the
contours for
O
 and S
and S from 80cm
 .
.
 |
The torus
densities are presented in the meridian plane for a longitude of
292 (where the magnetic and centrifugal equators coincide). In
order to allow direct comparison with [ Bagenal, 1994, figure 8]
we have used the
  + current sheet magnetic field
model. Apart from the differences at the centrifugal equator
already discussed,
the most notable difference is that the plasma is more tightly
confined to the equator at distances beyond about 8
 , producing
an appearance more of a plasma sheet rather than a sharp outer
boundary of a torus.
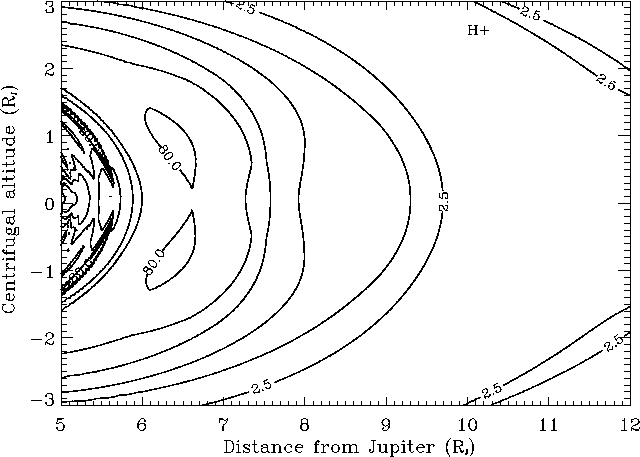
We have also plotted in figure 8 the contours of proton
density. It is worth noting that the inputs density and temperature for protons
(green lines on figure 4) are very badly known, especially because
protons have dropped below the energy threshold of the PLS detector [ Bagenal, 1994]
and so the proton density we obtain at the equator
(green line on top of figure 6)
has a bad reliability (it is however compatible with an upper limit of
 derived from whistler wave analysis [ Crary et al. 1996]).
Figure 8:
Contours of proton density in
the meridian plane for System III longitude
of 292 , with
 .
The contour levels are spaced by factor of 2.
 |
Nevertheless, we may observe that the maximum proton density is
offset from the centrifugal equator (about 8 centrifugal latitude).
As noted before, the latitudinal structure of the Io torus
depends fundamentally on the heavier ions (oxygen and sulfur) which dominate
the composition and which more strongly experience the confining centrifugal
force than the protons. This results in a rather
high electrostatic potential
  (see figure A2 in appendix)
in order to confine the electrons similarly as the heavy ions
so as to preserve the plasma neutrality.
The consequence on the protons is that the confining
centrifugal force is weaker at the equator than the electrostatic force, and
this tends to spread them out of the centrifugal equator.
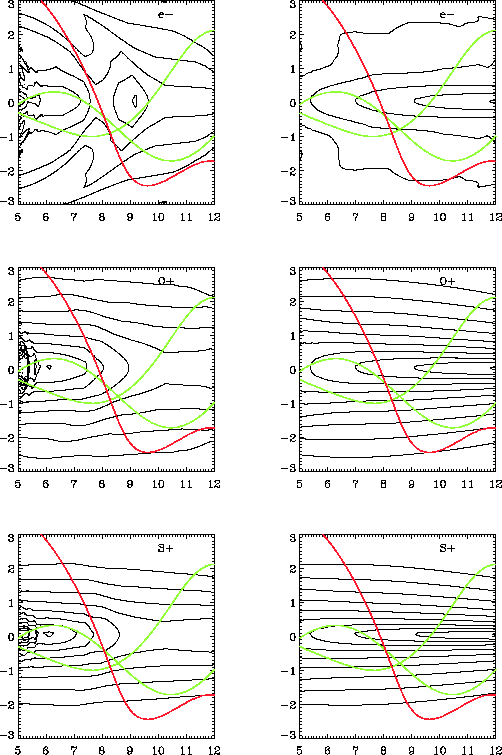
Figure 9:
(Left) Contours of temperature for  ,
,  and
and  in
the meridian plane for System III
longitude of 292
 .
The x-axis gives distance from Jupiter (
 ), the y-axis
gives centrifugal altitude (
 ).
).
 .
All contour levels are spaced by factor of 2. The
electron contours increase from 1eV. The ions contours increase from
10eV.
(Right) Temperature contours assuming an adiabatic L-dependence at the
centrifugal equator of L (orange line on figure
6). Coloured curves are the
trajectories of Ulysses (red) and of Voyager 1 (green).
 |
Figure 9 (left) presents isocontours of
temperature for electrons,  and
and  .
The temperature has a minimum at the
equator and increases (due to velocity filtration) with
latitude. Notice that the latitudinal temperature gradients are
stronger for the heavier (sulfur) species than for the oxygen species.
We have also plotted Figure 9 (right) the temperature
contours obtained assuming that the equatorial temperature decreases
adiabatically with radial distance (L
 ). The spacecraft trajectories
of Voyager 1 (green) and Ulysses (red) have been superposed for illustrating
how one would expect a temperature increase to
be observed by Ulysses on its roughly North-to-South trajectory and
by Voyager 1 beyond
  , while the equatorial temperature is assumed
to decrease with distance from Jupiter.


Next: 5. Summary and Final
Up: 4. Building a 2-D
Previous: 4.2.3 Variation in temperature
Michel Moncuquet
DESPA, Observatoire de Paris
2001-08-28
![]() and
and ![]() , we present
contours of plasma density in Figure 7.
, we present
contours of plasma density in Figure 7.

![]() derived from whistler wave analysis [ Crary et al. 1996]).
derived from whistler wave analysis [ Crary et al. 1996]).

