The dispersion equation for Bernstein waves
[Bernstein, 1958] is given in appendix B
(equation (B1)). Solving it requires knowledge of the plasma
frequency ![]() . However, we also give in this appendix the derivative of the
solutions of (B1) with respect to
. However, we also give in this appendix the derivative of the
solutions of (B1) with respect to ![]() (equation (B2)),
which vanishes rapidly when the ratio
(equation (B2)),
which vanishes rapidly when the ratio
![]() increases, especially in the first intraharmonic band.
This means that if the ratio is large enough (i.e.,
increases, especially in the first intraharmonic band.
This means that if the ratio is large enough (i.e., ![]() ,
where
,
where ![]() is the upper hybrid angular frequency, and n is the
number of the upper gyroharmonic limiting the band considered),
the solutions of this dispersion equation (B1) are not strongly
dependent on the plasma frequency, and
we only need a rough evaluation of
is the upper hybrid angular frequency, and n is the
number of the upper gyroharmonic limiting the band considered),
the solutions of this dispersion equation (B1) are not strongly
dependent on the plasma frequency, and
we only need a rough evaluation of ![]() to solve it.
During the 15 to 17 UT period, the plasma frequency is known
(deduced from the upper hybrid frequency line observed on the
high-frequency receiver
[Hoang et al., 1993]) with a mean error of
to solve it.
During the 15 to 17 UT period, the plasma frequency is known
(deduced from the upper hybrid frequency line observed on the
high-frequency receiver
[Hoang et al., 1993]) with a mean error of ![]() ,
and the ratio
,
and the ratio ![]() is always greater than n.
We can thus fit the solutions of dispersion equation (B1) to our experimental
dispersion points with a single parameter to fit: the gyroradius
is always greater than n.
We can thus fit the solutions of dispersion equation (B1) to our experimental
dispersion points with a single parameter to fit: the gyroradius ![]() of
the thermal electrons. We again use a
of
the thermal electrons. We again use a ![]() merit function to minimize
but with
merit function to minimize
but with ![]() taking into account errors in both coordinates:
taking into account errors in both coordinates:
![]() . The maximum value of
. The maximum value of ![]() can be computed using (B3) and it is
found to be
can be computed using (B3) and it is
found to be ![]() (see
the lower panel of Figure B1). This value
was used to compute the
(see
the lower panel of Figure B1). This value
was used to compute the ![]() and thus estimate the
standard deviation on each fitted
and thus estimate the
standard deviation on each fitted ![]() (note that this value is reached for rather small values of the ratio
(note that this value is reached for rather small values of the ratio
![]() , and so these standard deviations are in most cases
overestimated).
, and so these standard deviations are in most cases
overestimated).
It is then straightforward to get the electron
temperature:
![]()
where ![]() is the electron mass and
is the electron mass and ![]() is the Boltzmann constant.
is the Boltzmann constant.
The results of these fits are shown as solid lines on the eight samples of
Figure 4 with the computed temperature and its
relative error. All the results of these temperature fits to the 43
experimental dispersion curves available in that period (where the plasma
torus density is known) are shown in Figure
5 as triangles with solid error bars. This period corresponds to
a basically north-to-south trajectory of Ulysses spacecraft, with a large
latitudinal variation ( ![]() swept) and weak radial (distance to
Jupiter) variation (from
swept) and weak radial (distance to
Jupiter) variation (from ![]()
![]() to 8
to 8 ![]() ).
).
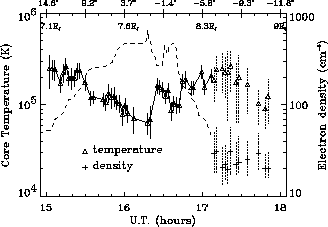
Figure 5: Temperature (triangles) and density (crosses) of electrons on the
Ulysses trajectory crossing the outer part of Io torus.
The dashed line recalls the density profile obtained by thermal noise analysis
[Hoang et al.,1993].
The dotted (and largest) errors bars indicate that the corresponding temperature
and density were both fitted from the experimental dispersion curve, as
explained in the text. We have indicated on the top axis some centrifugal
latitudes (positive degrees for north) and some Jovicentric distances (in
Jovian radius) of the spacecraft.
The new results about the IPT which appear
on Figure 5 are roughly that (1) the electron temperature rapidly increases
with latitude, and (2) temperature is strongly anticorrelated to the
density.
Note that the weak dependence of the fitted model of dispersion
on the ratio ![]() allows us to exclude the possibility that this
anticorrelation between temperature and density could
be a numerical artifact of our method.
For instance, this ratio varies from 7 to
11 (implying a variation of the dispersion equation
solution
allows us to exclude the possibility that this
anticorrelation between temperature and density could
be a numerical artifact of our method.
For instance, this ratio varies from 7 to
11 (implying a variation of the dispersion equation
solution ![]() )
during the period 1610 to 1640 UT, when there is a strongly anticorrelated
"arch" feature.
This important result suggests the existence of a polytropic state law
within the IPT, that is,
)
during the period 1610 to 1640 UT, when there is a strongly anticorrelated
"arch" feature.
This important result suggests the existence of a polytropic state law
within the IPT, that is, ![]() , with
, with ![]() , as
discussed by [Meyer-Vernet, Moncuquet and Hoang, 1995].
Since such laws are linked with non-Maxwellian velocity distributions, we
have to discuss the physical meaning of our derived temperatures in that case.
This will be done in section 4.
, as
discussed by [Meyer-Vernet, Moncuquet and Hoang, 1995].
Since such laws are linked with non-Maxwellian velocity distributions, we
have to discuss the physical meaning of our derived temperatures in that case.
This will be done in section 4.